
Operation Overpass: Part 2 - Covert QL
Initiate Your Journey into the Shadows of OSM Intelligence.

Welcome back. As we reconvene in the shadowy corridors of Overpass API, let us reflect upon the lessons from "Operation Overpass: Part 1 - Covert QL", where our journey into the realms of OSM and OSINT began. Equipped with Overpass API and Overpass Turbo, we mastered the basics of query crafting, setting a robust foundation for the intricate tasks that lie ahead.
In this session, we will start developing our skills in the Overpass QL, and I will introduce an analytical image evaluation process, 'D-DEC, ' to guide our quest to extract visual elements and define potential geographical locations for our queries.
Unravelling the Map: A Detailed Look at Nodes, Ways, Relations, and Tags & Values
Understanding and leveraging geospatial data effectively is crucial in the expansive field of OSINT. The primary elements of OSM—nodes, ways, relations, and tags & values—are invaluable tools in this endeavour, enabling analysts to extract detailed information from vast geographical databases. Let’s explore these elements to understand how they facilitate comprehensive geospatial analysis.
Nodes: Pinpointing Specific Geographical Details

Nodes are the most granular elements within OSM, marking specific geographic coordinates. They identify exact points such as landmarks, junctions, or the corners of significant structures. When analysing an image that features a distinctive object or location, corresponding nodes in OSM can verify or suggest the geographical positioning of these elements. For instance, a node might represent a notable sculpture at a precise latitude and longitude, directly linking the visual data and its real-world location.
Ways: Mapping Linear and Areal Features

Ways are essential for depicting linear or areal geographical features in OSM, such as roads, rivers, or the perimeters of parks and buildings. In geospatial analysis, ways help correlate elements within an image to their geographical counterparts. Matching the visual representation of a road or a building outline with the ways defined in OSM can pinpoint the exact or potential locations depicted in the imagery. This correlation is vital for enhancing the accuracy of geospatial data interpretation.
Relations: Interpreting Complex Geographical Structures

Relations describe how various OSM elements—such as nodes and ways—are interconnected, representing multi-dimensional structures like transportation networks or groups of buildings. Analysing relations allows for a more nuanced understanding of complex geographical setups. For instance, if an image captures an integrated network of roads and buildings, examining related OSM elements can help identify the specific area by matching these complex structures.
Tags and Values: Enriching Data with Detailed Descriptions

Tags and values add a layer of descriptive detail to nodes, ways, and relations in OSM. They provide insights into the type of object, its historical context, physical characteristics like colour and material, and other specific attributes. These descriptors are crucial for verifying the accuracy of image-based analysis. For example, a building tagged with a particular architectural style in OSM can confirm hypotheses about the location or characteristics of buildings seen in an image.
Leveraging OSM for Enhanced OSINT
By understanding how to use and interpret nodes, ways, relations, and tags & values, OSINT practitioners can easily navigate and analyse the geographical data landscape. These elements form the backbone of effective geospatial intelligence, turning raw map data into a structured, query-able repository that supports diverse analysis needs. As we continue to delve into these tools, remember that each element not only represents a point on a map but is a critical piece of the larger puzzle in our quest for comprehensive understanding and application in OSINT tasks.
The Analytical Process 'D-DEC': From Image to Insight
A new tool in our arsenal, the 'D-DEC' process, stands for Define, Describe, Evaluate, and Conclude. This methodology can be effective in analysing and extracting actionable intelligence from geospatial imagery.
The image below (Image 1) will be used to provide context for this process.
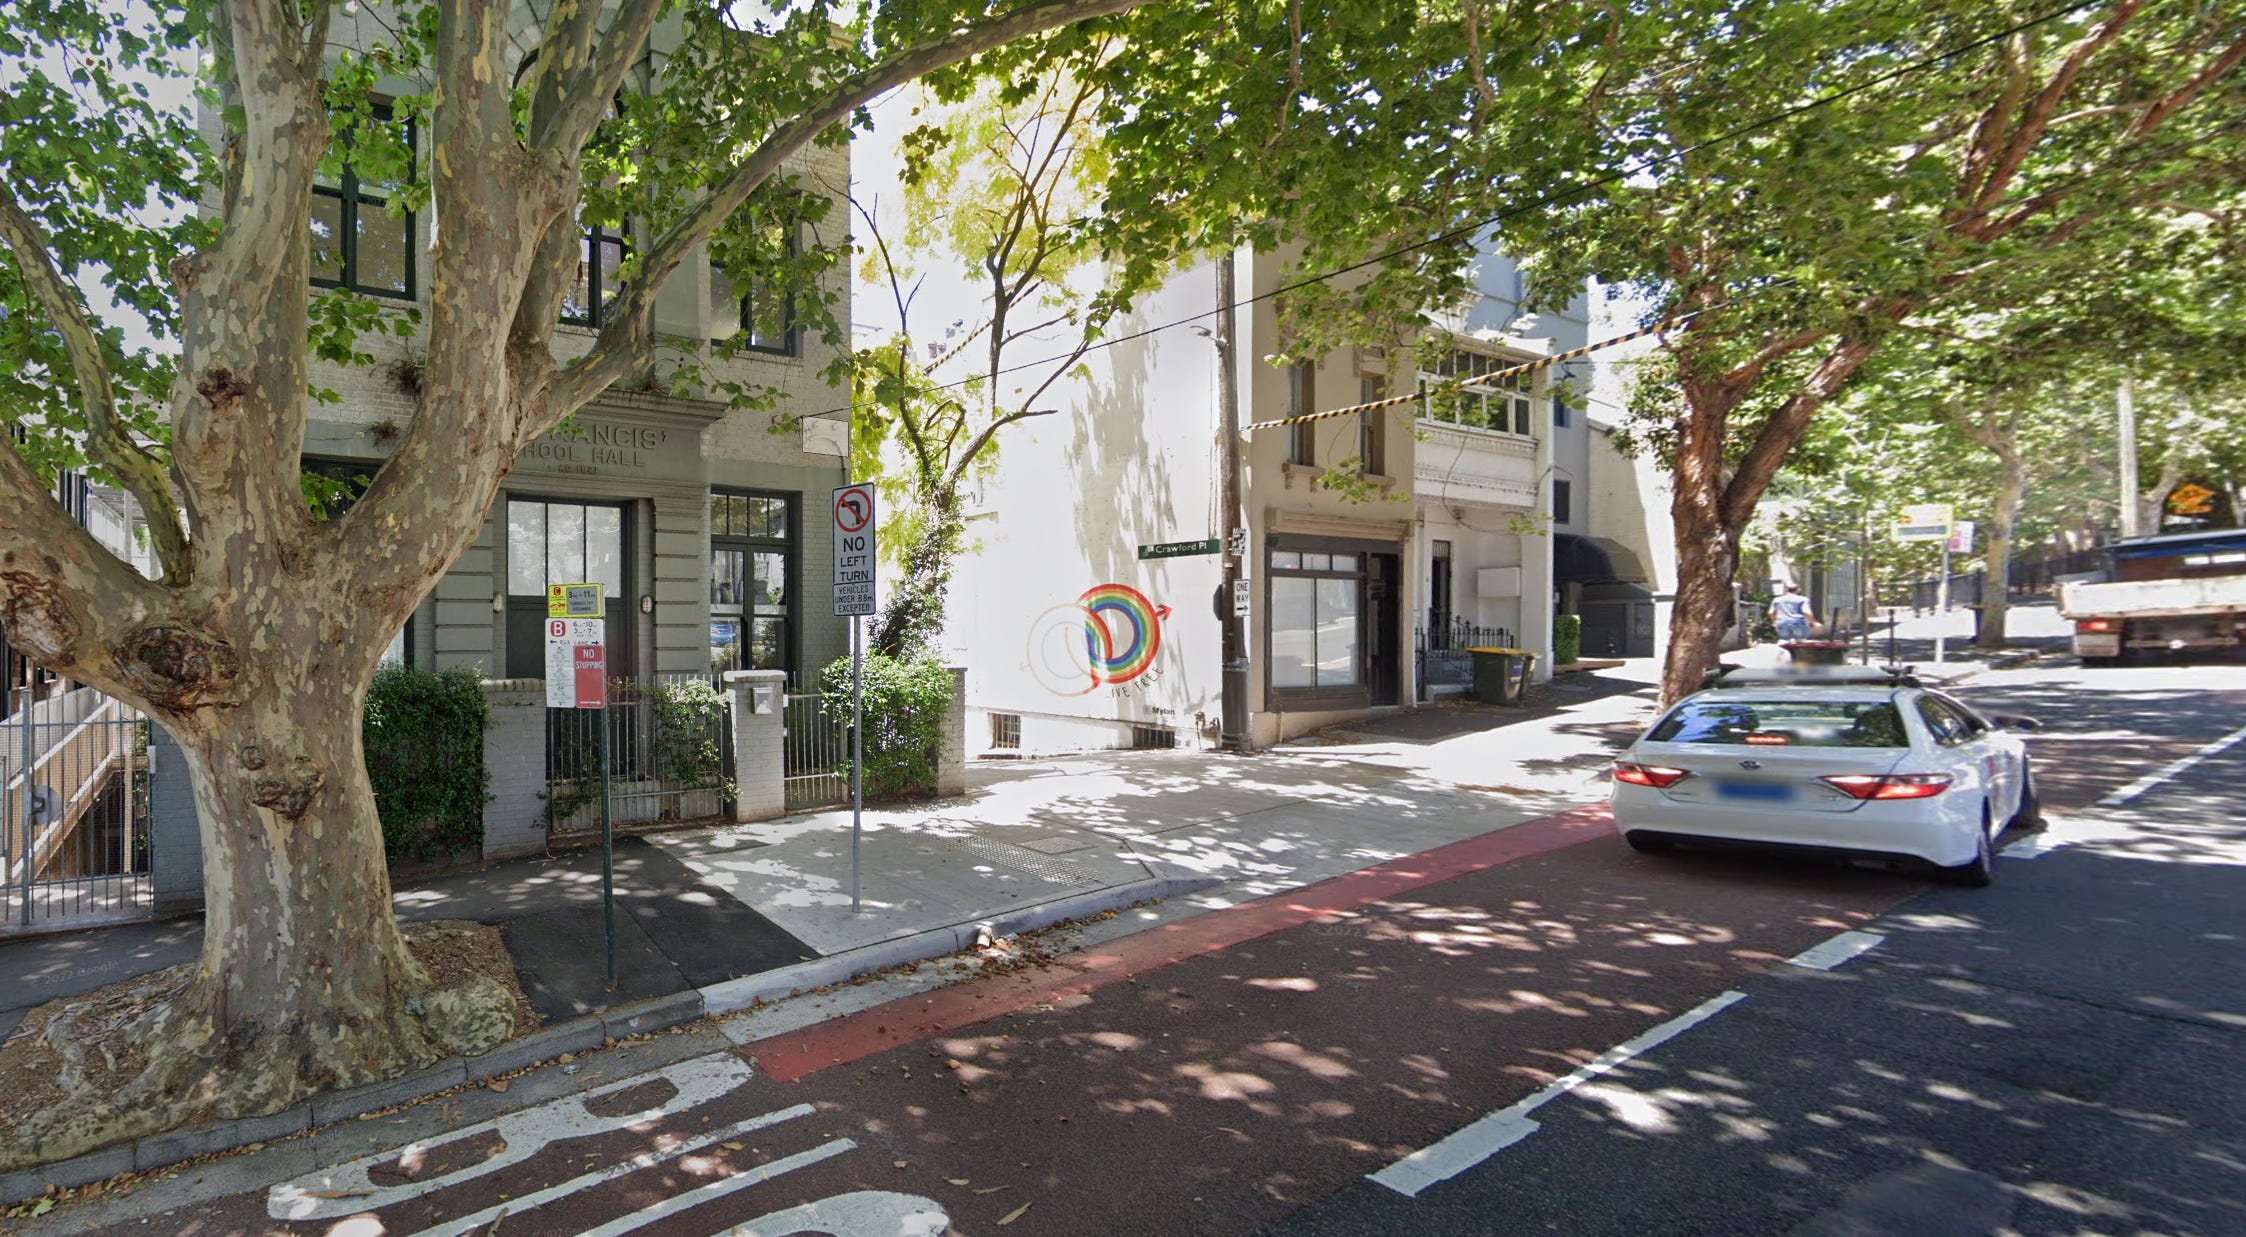
Define—Gather basic facts about the environment in the image.
We can define this as an urban environment.Describe—Develop a descriptive information set about the area defined in ‘Define’ (Step 1). Identify existing natural conditions, infrastructure, and cultural factors. Consider all details such as weather, vegetation, roads, facilities, language, and social, ethnic, religious, and political factors. Layer this information onto the foundation developed in Component 1.
The following detailed description pertains to the environmental analysis of a specific urban locale captured within the analysed image.

Environmental and Architectural Characteristics

> Urban Development and Architecture (1a): The locale is characterised as a well-established city or town exhibiting a diverse range of architectural styles, indicative of historical evolution and modern development . Notably:
    >> The building on the left is named, although only partially visible, suggesting a possibly significant or landmark structure. It spans multiple levels, adding to the urban density and utility of the space. (1b)(1c)
    >> Similarly, the building on the right also features multiple levels, supporting the notion of a densely built environment conducive to varied residential or commercial uses. (1d)

> Infrastructure and Public Services:
    >> The presence of a dedicated bus lane indicates a well-organised public transport system designed to support a substantial population.(2)
    >> Taxi services are operational, further underscoring the urban setting's accessibility and mobility. (3)
    >> The establishment of mature trees along the roads enhances the aesthetic and environmental quality of the area.(4)
    >> The infrastructure is well-used, suggesting high traffic and utilisation, with roads showing signs of wear.

> Environmental and Social Indicators:
    >> The weather is reported as bright and sunny, typical of temperate climate zones during favorable weather periods.
    >> Graffiti observed in a laneway could indicate vibrant local culture or social expressions, though its presence might also suggest areas of lower surveillance or informal social control. (5)
    >> The terrain is noted to be on a slight incline, providing a topographical dimension to the urban landscape.
    >> Street garbage collection services are in place, pointing to organised municipal services. (6)

Signage and Communication:
    >> Various signs, including a street sign and multiple road signs, are present and written in English, reinforcing the English-speaking context identified earlier.(8a)(8b)(8c)(8d)
    >> Street lighting and visible power or telephone cables are consistent with well-established urban infrastructure, ensuring functionality and connectivity.
Evaluate—Evaluate objects discovered during ‘Describe’ (Step 2).
(1a) Neoclassical 1800’s to early 1900’s (left) and Modernist mid-1900’s (right) architecture.

(1b) Building name partially visable. “(?)ANCIS ?HOOL HALL AD 1921”

(1c) Building is >=2 levels with a possible basement level, based on incline and the building on the left.

(1d) Building on left has 2 levels plus 1 basement level.(2) Bus lane is well defined in left hand lane. Bus lane is also defined in solid red block colour.(3) Taxi looks to be right hand drive and is a Toyota, possibly a Camery. Number/licence plate of taxi is blurred but is solid blue in colour with black lettering.(4) Trees to be well establish, Oak? London Plane Trees? Leaves on the tree a green and lush. Trees tend to be grown in temperate climates. (5) Grafitti in laneway is undefaced, possibiliy commesioned or accepted by community and signifies ties with the LGBTQI+ community. Text on grafiti is “Live Free”(7) Wording reads "Mylan" and contains a blue logo outlined by a black box.(8a) Visable Street sign reads “Crawford Pl”
(8b) 1st sign, 4 parts:
1. Tow away area (3pm to 11pm) Tuesday 2? December.
2. Bus Lane 6am to 10am and 3pm to 11pm. Monday to Friday.
3. “2P”, “3P”, “4P”
4. No Parking
(8c) 2nd Sign, 2 parts:
1. “No Left Turn”
2. “Vehicles under 8.8m"
(8d) 3rd, 1 part:
1. “One Way”Conclude—Combine findings for components 1-3 to develop analytic conclusions.
The following report outlines the conclusions derived from an exhaustive analysis of a recently obtained image, conducted as part of ongoing intelligence efforts. The assessment was aimed at identifying the probable geographical context and specific locational details depicted in the imagery to aid in field operations.

Detailed Analysis Outcomes
Geographical and Cultural Context: The image analysis indicates that the depicted environment is within an English-speaking metropolitan area where the right-hand traffic rule applies, and the metric system is used. These characteristics strongly suggest the location is possibly within the Commonwealth nations, excluding the UK due to the right-hand driving criterion.

Climatic Considerations: Observations related to vegetation and general weather conditions within the image suggest a temperate climate. This information narrows down the potential geographic zones further, aligning with regions known for mild seasonal variations and moderate weather patterns.

Urban Layout and Infrastructure: The visual data has identified a specific street, named “Crawford Pl,” which features prominently in the image. This street is characterised by a one-way traffic system and includes a dedicated bus lane, indicating a well-planned urban area with considerations for public transport and traffic management.

Architectural Significance: A key architectural element within the image is a building marked as “(?)ANCIS ?HOOL HALL AD 1921.” This structure is located approximately 15 meters from “Crawford Pl.” The style and designation of the building suggest historical significance and potentially educational use, marked by its foundational date.

......
Applying Conclusions to Geospatial Queries
It is crucial to understand that our aim here is not to pinpoint the exact geospatial coordinates of the image but to utilise the derived information to craft highly targeted queries in OSM. While not every detail observed in the analysis will correspond directly to data points within OSM, the database's extensive coverage often yields surprisingly detailed information that can be leveraged for in-depth analysis.
The insights derived from the image guide the construction of our queries, focusing on identifiable and verifiable features. The initial analytical conclusions drawn from the image provide the basis for further refining our search parameters through additional research and verification, ensuring that our approach to querying OSM is both methodical and precise.
Integrating Rigorous Image Analysis into OSINT Investigations
This strategic use of image-derived information underlines the importance of meticulous analysis in enhancing the effectiveness of OSINT operations. By transforming visual data into structured, detailed narratives, we equip ourselves with the tools necessary for advanced geospatial intelligence tasks, turning every image into a significant contributor to our investigative endeavours.
Practical Application: Overpass Turbo
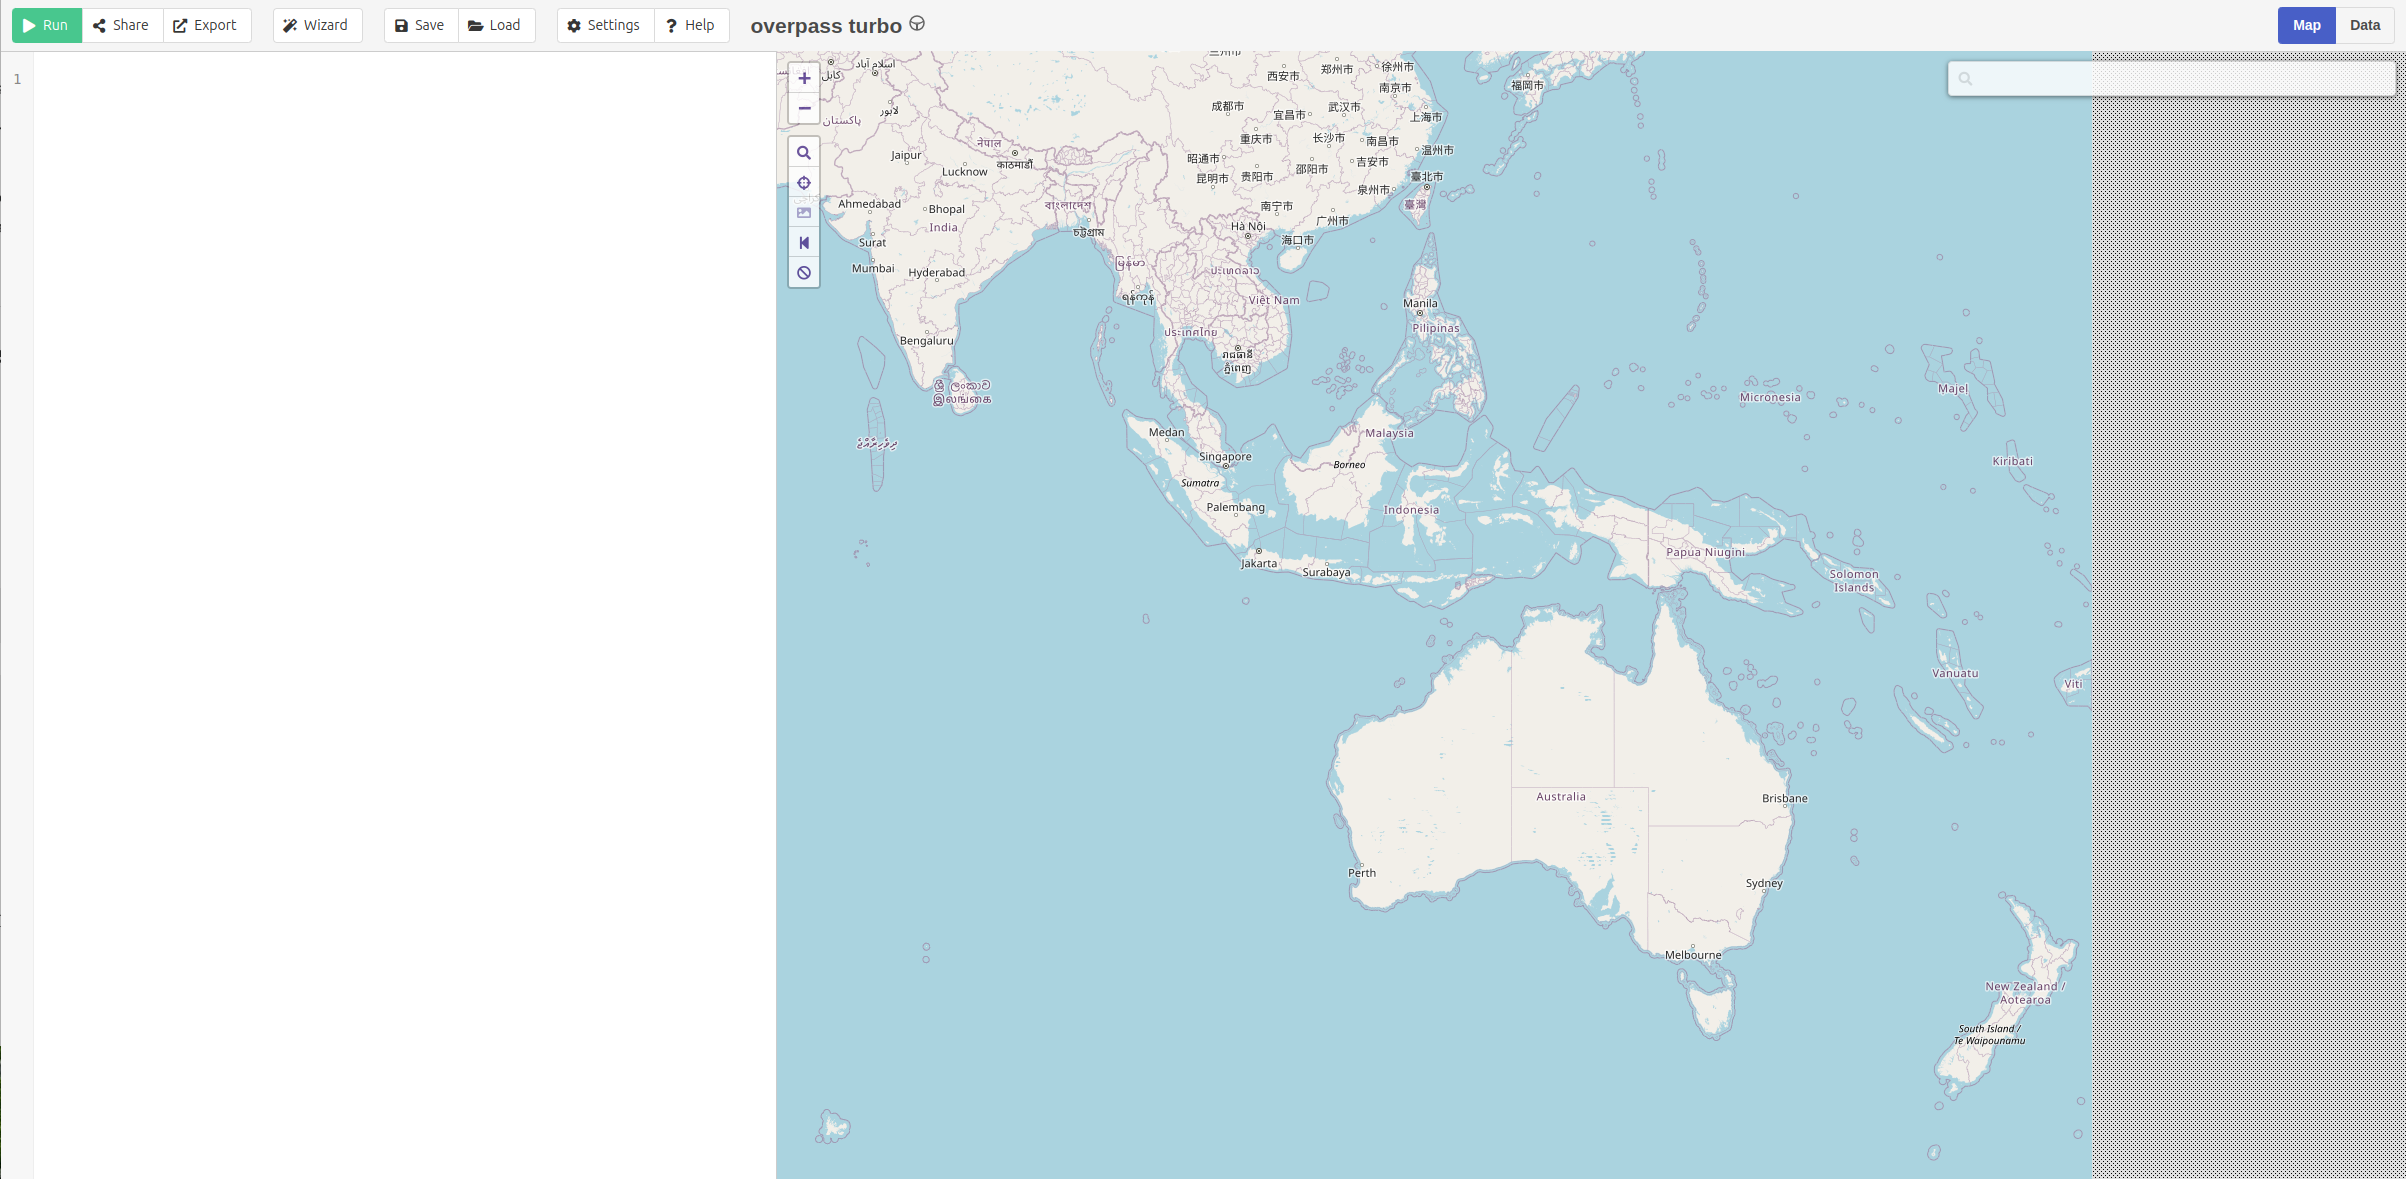
As we plunge further through our journey into the enigmatic domain of Overpass API, it becomes essential to adeptly navigate Overpass Turbo, our primary conduit for executing and refining our Overpass API queries. This user-friendly platform is intuitive, ideal for both newcomers and seasoned analysts. I encourage you to immerse yourself in Overpass Turbo: explore its functionality, interact with the map, and familiarise yourself with its key sections—the left pane for building queries, the right pane displaying OSM data, and the toolbar where the pivotal ‘Run’ button resides.
Defining the Search Area
Today, we shall start by exploring the art of defining a search area using Overpass QL, focusing on fundamental methods like the bounding box and area functions. These initial steps are crucial for honing your precision in geographical targeting.
Engage directly with the query builder by typing queries manually. This practice will commence your understanding of the query language and enhance your ability to construct effective searches. Once you execute a query, analyse the elements and metadata returned—this will enrich your grasp of how Overpass Turbo harnesses OSM data for OSINT purposes.
Manually define a bounding box (on the OSM map screen, it’s the third button down under the zoom functions) and return all nodes, ways and relations.
(
	nwr({{bbox}});
	<;
);

out meta;
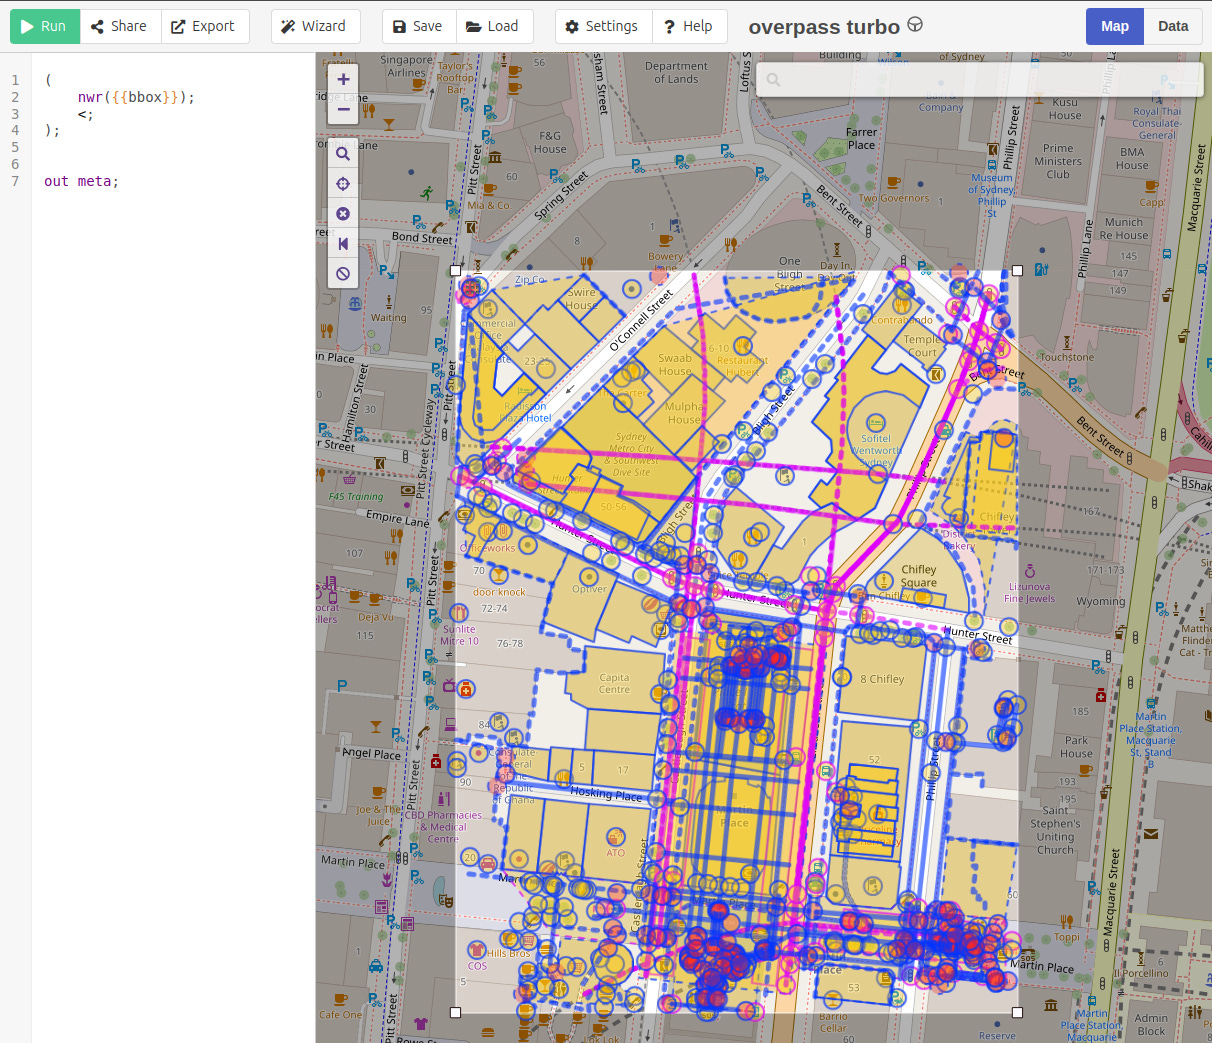
This command prompts the OSM API to retrieve all nodes, ways, and relations within the specified bounding box ({{bbox}}). The ‘Recurse up’ operation (<;) collects all associated higher-level elements, while out meta; ensures detailed metadata about each element is included in the output. Various output types can be explored in further detail here.
In the enigmatic world of Overpass QL, the notion of "recursing up" plays a pivotal role. This query mechanism begins with a specific element, such as a node, and ascends through the data hierarchy to uncover all-encompassing, higher-level elements like ways or relations that incorporate this node. This stands in contrast to "recursing down," >; where the process starts with a more comprehensive element and drills down to reveal all its underlying components, such as the individual nodes within a way. In an upcoming lesson, we will explore the intricacies of recursion in greater detail. For now, it's crucial to understand that employing "recursing up" within your queries will effectively retrieve all pertinent data confined within the specified bounding box, ensuring a thorough and comprehensive dataset for your analysis.
Geocode a search area and return all nodes, ways and relations.
In this example, we'll demonstrate two distinct yet functionally equivalent methods to define a specific search area within Overpass Turbo. Both approaches aim to target the same geographic location effectively but utilise slightly different syntaxes to initiate the search.
First Method: Using Named Area
This method directly uses the named area to specify the search zone within Overpass Turbo:
area[name="Taronga Zoo"]->.searchArea;

(
	nwr(area.searchArea);
	<;
);


out meta;
Second Method: Using GeocodeArea
This approach leverages the geocodeArea function to more precisely define the search area based on geocoding data, enhancing the accuracy of the boundary definition:
{{geocodeArea:"Taronga Zoo"}}->.searchArea;

(
	nwr(area.searchArea);
	<;
);


out meta;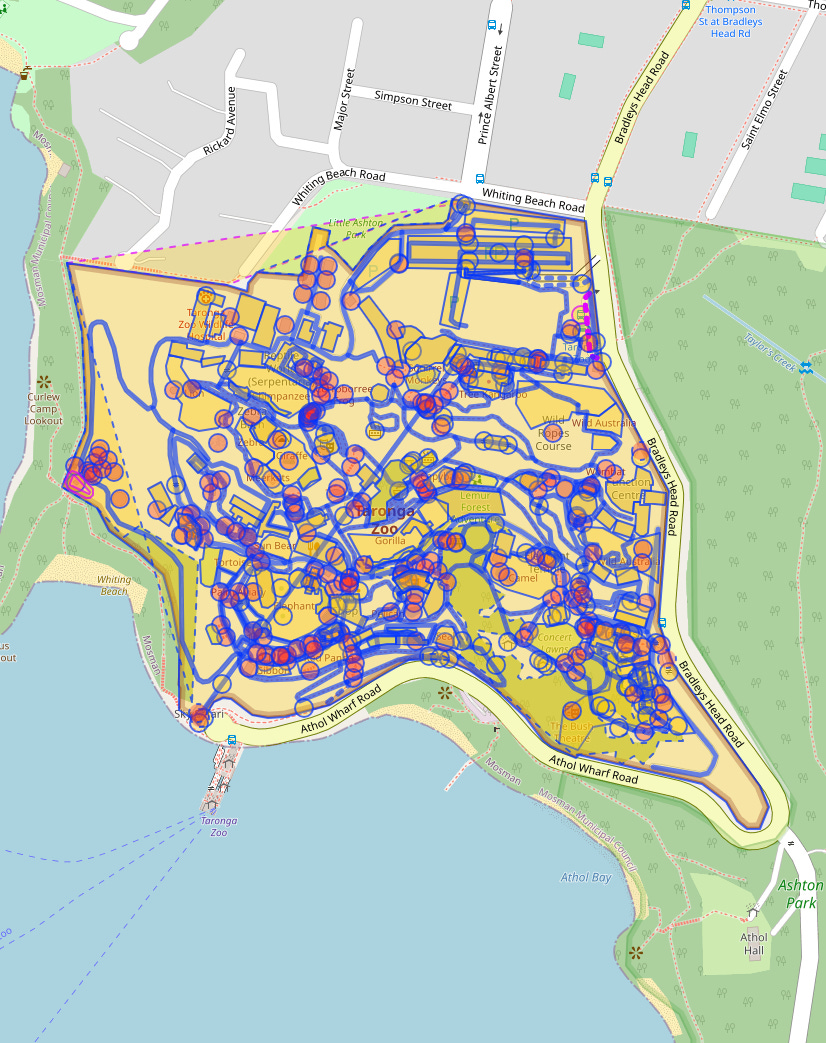
Both queries are designed to retrieve all nodes, ways, and relations from the specified area, "Taronga Zoo," either through directly naming the area or by using geocoding to establish the search perimeter. The choice between these methods can depend on the user's preference for simplicity or precision. Using geocodeArea can be particularly useful when precision is critical or when the named area might be ambiguous or not uniquely defined in the database.
In practice, both queries will yield similar results in terms of the data returned, but the geocodeArea approach provides an additional layer of accuracy, ensuring that the search area is defined as precisely as possible according to the latest geocoding data available. This can be especially important in operational contexts where geographic precision is required for detailed analysis and decision-making.
I was going to expand further and look at searching for individual elements, but I will leave it here for now as it is becoming a very long-winded but hopefully informative article. We will cover this in the next article. In the meantime, I will leave you with some homework.
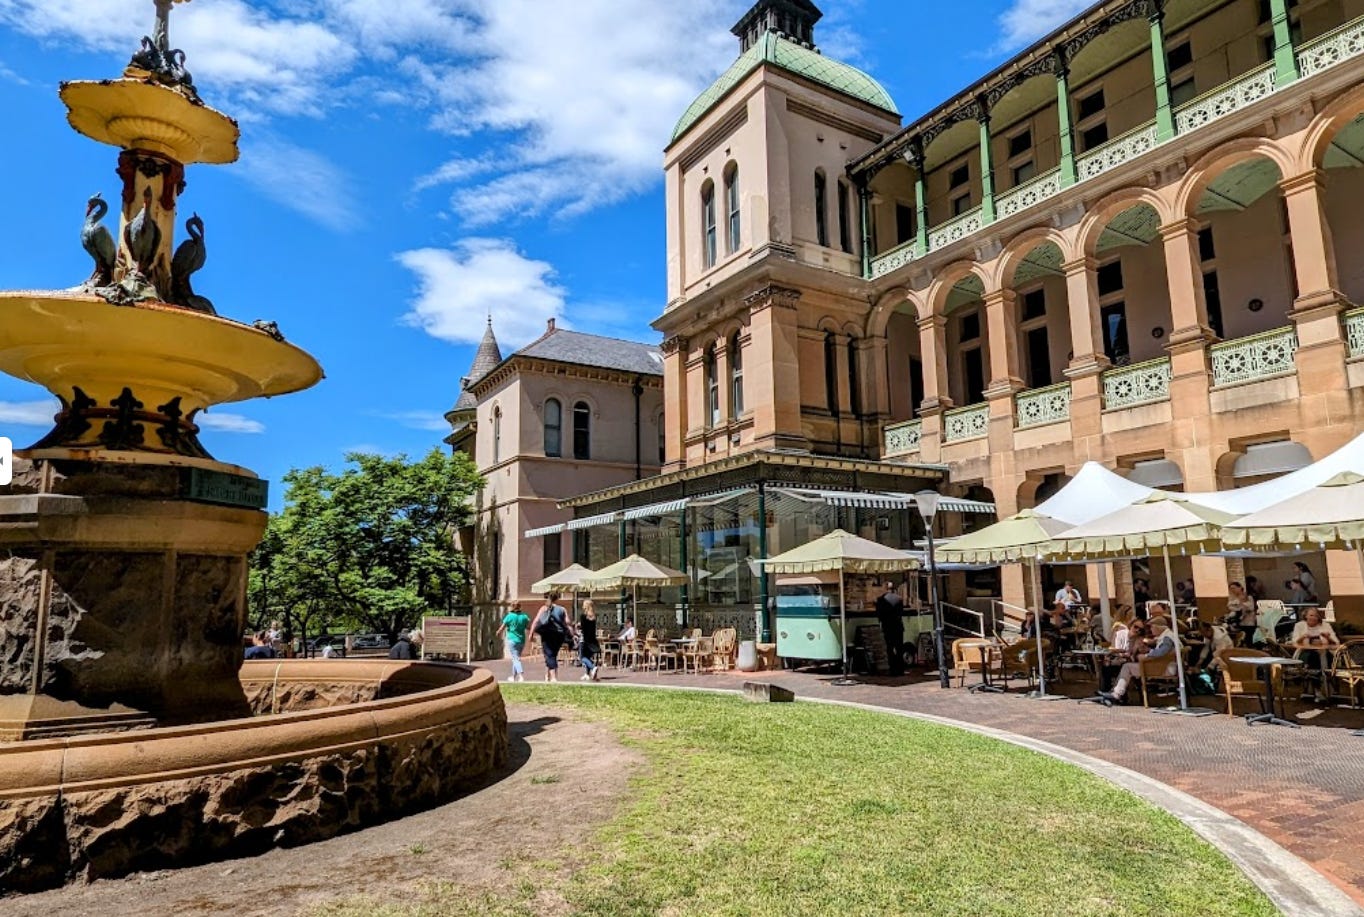
Exercise 1:
Apply the D-DEC process to the below image. Aim to identify and document as many distinct features and details as possible. This exercise is designed to prepare you for more intricate analyses in future lessons.
Exercise 2:
Experiment with bounding box and area queries. Manipulate different geographic parameters, explore various locations, and observe how changes in your query affect the results. This practical engagement is key to mastering Overpass Turbo.
I'd like to give a heartfelt acknowledgment to E!, huggedthewind, and ElasticPanda, who have inspired and supported the creation of this series. Crafting these articles is an intricate task, akin to the detailed work undertaken in OSINT—each step requiring precision and thoughtfulness.
In our forthcoming dispatch, "Operation Overpass: Part 3 - Covert QL", we will venture deeper into the covert intricacies of OSM, sharpening our tools for crafting queries that transcend mere searches to become strategic explorations. Here’s what awaits in our next thrilling instalment:
Enhancing Our Arsenal: We will delve into the art of adding elements to our search queries, expanding the breadth and depth of our investigative reach within OSM's vast digital landscape.
Precision Through Refinement: We'll focus on refining our search tactics and incorporate additional keys to hone in on the most pertinent and actionable data, ensuring every query not only searches but uncovers with unmatched precision.
Mastering the 'Around' Function: We will explore the tactical deployment of the 'around' function, a crucial maneuver in Overpass QL that allows us to define our search perimeter with surgical accuracy based on specific geographic landmarks or boundaries.
Styling the Map with MapCSS: We shall introduce the technique of applying MapCSS to style our maps, enhancing the visual clarity and impact of the data unearthed through our queries. This will not only aid in interpreting results but also in the strategic presentation of findings.
Prepare to deepen your engagement with the digital underpinnings of OSM, enhancing your capacity to navigate and control the intricate web of data that Overpass QL offers. Keep your analytical tools sharpened and your strategic wits about you. As we continue to navigate the hidden corridors of data within OSM, let each discovery fuel your journey deeper into the covert world of OSINT.
Until our paths cross again in this ongoing saga, continue your vigilant exploration of the digital landscape and brace for the revelations that await in our next encounter with the enigmatic world of Overpass QL.
Journey deeper into the data labyrinth. See you on the other side.
-- ClearInsight